From BI to CI: the launch of Customer Intelligence

7 min read

It is a truth universally acknowledged that a CSM in possession of a renewal base, must be in want of a dashboard. But a mouth wateringly beautiful dashboard, comprised of customised insights from any conceivable data and filtered to your heart’s content, was the stuff of dreams… until now.

At Planhat, when we look to the future of Customer Success, we see two key trends.

Firstly, customer success will become more data driven. This doesn’t necessarily mean more automations and ‘the robots taking over’, but simply that more CS decisions will be made using data from the myriad of systems connected to your customers.

Secondly, we see a constant move towards increased collaboration and transparency between vendors and customers. It will be standard to share statuses, tasks and data with customers, and create transparent feedback loops so they know exactly where things stand at any point in time.

With this blog post, we are officially launching our new Customer Intelligence module, a module designed to provide all the data and insights a Customer Success organisation could need to understand exactly what is going on with their customers, from any angle imaginable.

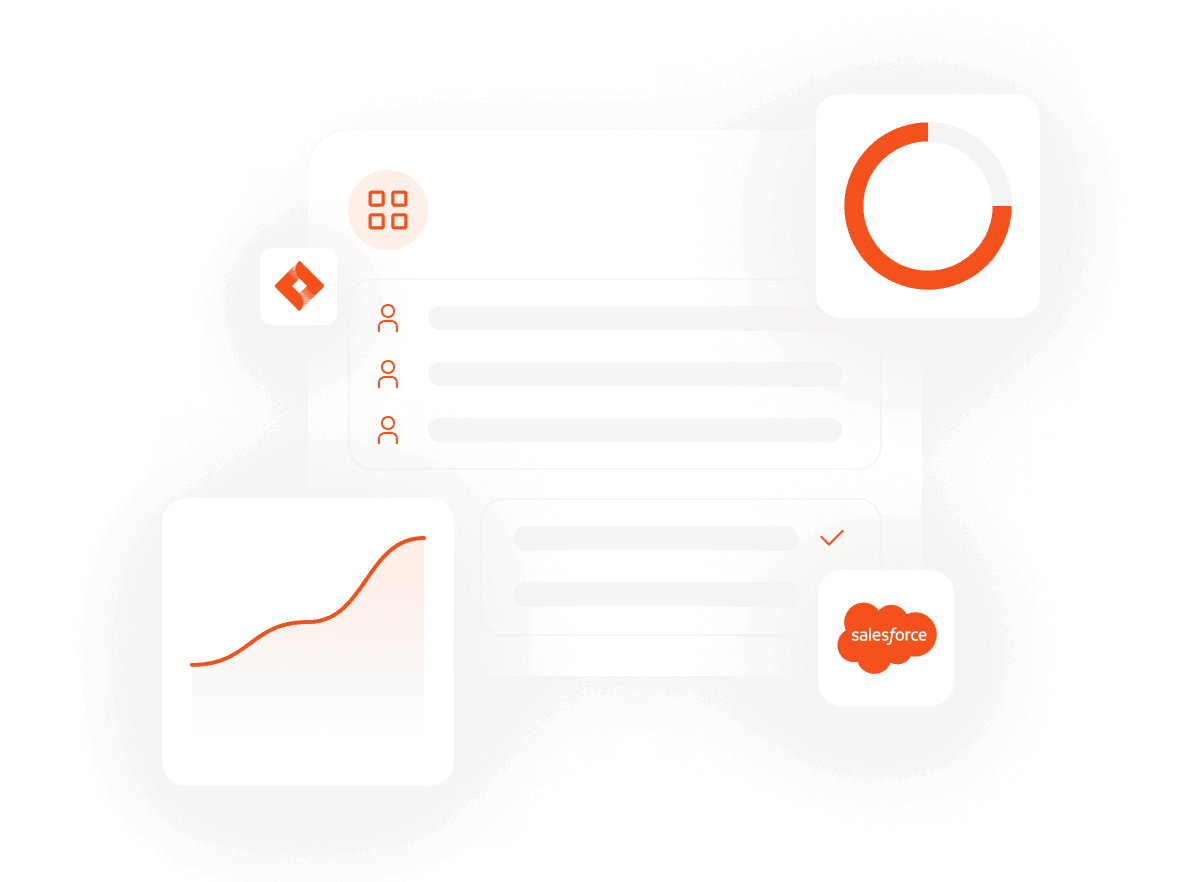
Planhat CI Module

Among other things, Planhat’s Customer Intelligence module includes:

  1. Unlimited Beautiful Dashboards - A market leading business intelligence tool built specifically for Customer Success, to visualise any customer data and create beautiful, intuitive, customised dashboards with the freedom you’ve always wanted!

  2. Your own Health Laboratory - A new way to experiment with health scores, simulate changes and provide insight into hidden biases buried within different rules.

  3. Metric Trends & Analytics - Charts and tables of all metrics tracked by Planhat, including usage, conversations, revenue data and more, with the ability to merge and blend diverse data sets regardless of their source, into customised calculated metrics to drive your business.

In CI you can take any data point you have in Planhat, and visualise it in almost any way you can imagine. You can build dashboards that dissect a specific issue from every conceivable angle, or build a dashboard that covers all key aspects of your business in a single, simple view.

Dashboards in Planhat are created by building and combining different widgets. There’s no limit to how many widgets you can have on a dashboard, so your ability to tell a story with data is limited only by your creativity. What’s more, any dashboard can be filtered on any customer, and any dashboard can be shared as a dynamic webpage for QBRs, EBRs, Board Meetings and more.

Let’s take Health Scores as an example. Health Scores are an important indicator for Customer Success, and a good health score will always drive action from a Customer Success team. In CI you can take the health score(s) you’ve built in your Health Lab (see below) and slice and dice them faster than Gordan Ramsey in a fit of rage. Here’s some interesting views that take 10 seconds to brainstorm:

Health Score Development over time
Health Score Development by customer segments
Development of Enterprise client health vs SMB client health..
Your next 3 month’s renewals by Health.
Your total portfolio distributed by Health
Health Score Development compared to CSM Score development
Your Top 20 customers by current health.
Health Score development compared to customer usage.
The list goes on…

When you think of single dashboard topics, the list of potential subject areas is endless. Customer usage data is a classic, taking all the data points you have to measure how your customers engage with your product, visualising them for your total portfolio, specific segments and individual customers and then sharing the dashboard with each customer so they have a full understanding of how they use your product and the value they derive.

Other individual topics that provide fascinating insights include:

Conversations and how you engage with your customers
Churn… it happens… but why?
Revenue development
Task management

Another amazingly insightful way of using CI is to build dashboards around your custom data. Custom data can be brought in to Planhat via integrations, our API, created natively or simply imported from a file. You can have unlimited custom fields on any object, and you can now visualise them.

For example, internally we like to keep track of which systems (CRM, Tickets, Chat, Email, Marketing, Revenue) our customers are using. We can now easily visualise them and dissect by any other data point, for example, geography or time. So in a weird way, we have an amazing insight into the geographic development and spread of the world’s leading CRMs. (Salesforce, Hubspot, Pipedrive, let us know if you’re reading…!)

You can also create dashboards that focus across any number of data points, so other use cases are Management dashboards, highlighting key areas within your data, and CSM dashboards ensuring all CSMs understand what is going on across each other’s portfolio.

Rather than describe them all, here are some examples to get your creative juices flowing:

Management Dashboard

Planhat CI Management

CSM Dashboard

Planhat CI Module

Usage Dashboard

Planhat CI Module

Customer Data Platform

Now it goes without saying that dashboards are only as good as the data upon which they are based. Planhat is a customer data platform at its core. We pull in data from almost unlimited sources given our many native integrations, open API and ability to import data from files.

Normally all this data lives in different systems and different data tables, but in Planhat, regardless of the data source you can combine, blend and merge data into unique, custom, calculated metrics.

For example, you can blend data from Zendesk with data from Gmail and Intercom to understand how often you have been in touch with your customers in a given time period. You can even run formulas across this data regardless of the source. For example, you can tell Planhat to group your raw usage data so that the different modules within your product are each isolated, and then create a metric telling you what percentage of modules each of your customers are using, and build out alerts and automations as this behaviour changes.

In CI how we display these diverse metrics has been re-designed to make it easier than ever to understand trends and patterns across your portfolio, benchmark different metrics and calculate the best metrics to drive your business.

The Health Lab

Health Scores have been central to Planhat since Day 1. You can create multiple health scores to ensure the logic matches the customer type and each health score can be based on any data point in Planhat.

Planhat CI Health Lab

Often people like to think of Health Scores as the oracle. “If we can figure out our Health Score, churn will disappear…”. The reality is that a health score is an indicator that should drive CSM action, but is only ever an indicator. However, the accuracy of that indicator is often influenced by unconscious bias in the mind of the health score designer.

Health Scores in Planhat have now been updated and built into a Health Lab. The Health Lab is a place to experiment with different rules, simulate how these rules impact your portfolio, identify biases within them and understand the impact before saving and locking them in. Incredibly, it turns out that despite years of frustration in CSMs globally, designing health scores can actually be fun!

In summary, we are really excited by Customer Intelligence. There is a lot to it, its a great platform for the future, and we believe a huge amount of value will be realised by our customers using CI in the coming months and years.

Enjoy, and please let us know what you think.

Team Planhat

Join our newsletter!

Receive the latest news, updates, and invitations to our events.

Being data-driven, are we there yet?

Being data-driven should be standard nowadays, but many organizations still struggle with it. Every company wants to be data-driven, but putting it into practice is the tough part.

How to transition from a cost center to a profit center in CS

Many in CS shy away from the commercial aspects of the business, but it's a missed opportunity to keep the conversation moving around maximizing and driving value for customers.

It's worth the risk: Identifying and managing risk in CS

When faced with risk in CS, it’s hard to know what the first step should be. We've developed an actionable plan based on experience from three CS experts.

Learn more about
Planhat

Drop your email and let us show you our platform!